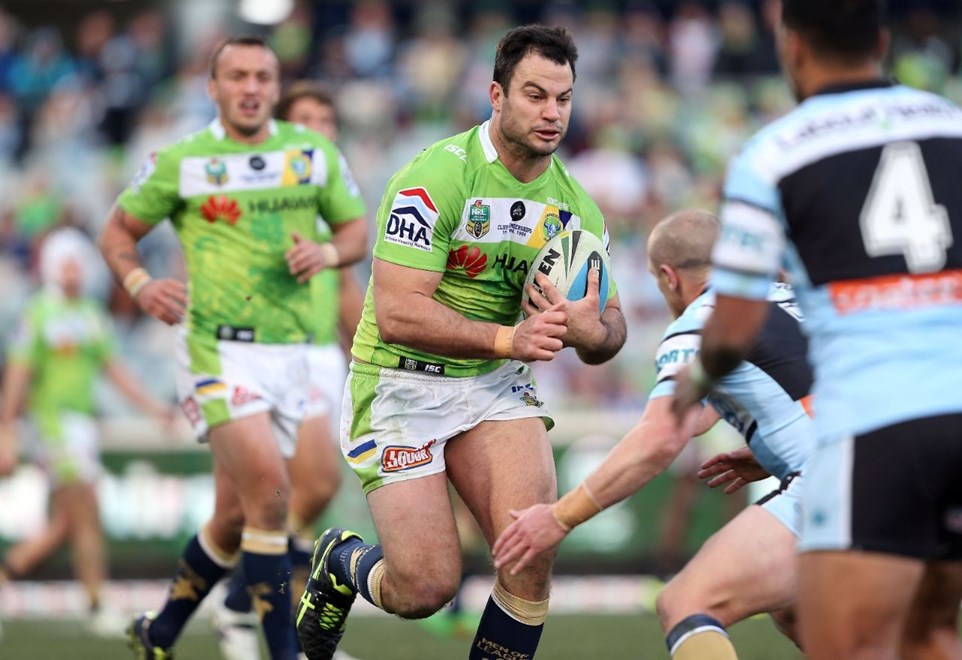

Metre Eaters:
1. David Shillington 154 metres
2. Edrick Lee 140 metres
3. Sia Soliola 139 metres
Top Tacklers:
1. Shaun Fensom and Sia Soliola 44 tackles
2. Josh Hodgson 36 tackles
3. Josh Papalii 32 tackles
Most Creative:
1. Blake Austin 1 try assist and 1 line break assist
2. Josh Hodgson and Jack Wighton 1 try assist
3. Sisa Waqa 1 line break assist
Second Phase Play:
1. David Shillington 7 offloads
2. Edrick Lee and Sisa Waqa 3 offloads
3. Jordan Rapana, Blake Austin, Jack Wighton,
Damaging Runners:
1. Josh Hodgson 1 line break and 6 tackle busts
2. Blake Austin 1 line break and 3 tackle busts
3. Jarrod Croker 4 tackle busts
Line Breaks:
The Sharks registered 6, double the amount the Raiders made.
Kick Metres:
1. Blake Austin 8 kicks for 314 metres
2. Jack Wighton 6 kicks 171 metres
3. Josh Hodgson 4 kicks for 109 metres
Possession Rate:
The Sharks enjoyed 59% of possession.
Completion Rate:
The Raiders completed 29 out of 39 sets for a completion rate of 74.4%, whilst the Sharks had a completion rate of 78.7%.
Errors:
The Raiders registered 9 errors whilst the Sharks registered 12.
Line Drop Outs:
The Raiders were forced to perform 2 line drop outs, whilst the Sharks never once had to perform a line drop out.
Missed Tackles:
The Raiders missed 26 tackles, whilst the Sharks missed 23.
Penalties Conceded:
The Raiders conceded 10 penalties, whilst the Sharks conceded 8.
*Statistics provided by ProZone Sports.


