
With the 2019 draw being released on Thursday, we've delved into the numbers to see what it means for next year's campaign.
Overview
Teams we play twice: Storm, Cowboys, Eels, Sea Eagles, Panthers, Roosters, Tigers, Sharks, Warriors.
Teams we play once: Titans, Knights, Broncos, Rabbitohs, Bulldogs, Dragons.
Day-by-day breakdown: Thursday - One, Friday - Four, Saturday - Nine, Sunday – Ten.
Five-day turnarounds: 2 (Rd 2, Rd 20).
Difficulty
For the purpose of gauging the difficulty of each opponent, we have graded them on a scale of 1-4 depending on how they finished the previous season.
4 = 1st – 4th
3 = 5th- 8th
2 = 9th – 12th
1 = 13th – 16th
To calculate the perceived difficulty of the draw, we have gathered the average difficulty and compared it across the last five seasons.
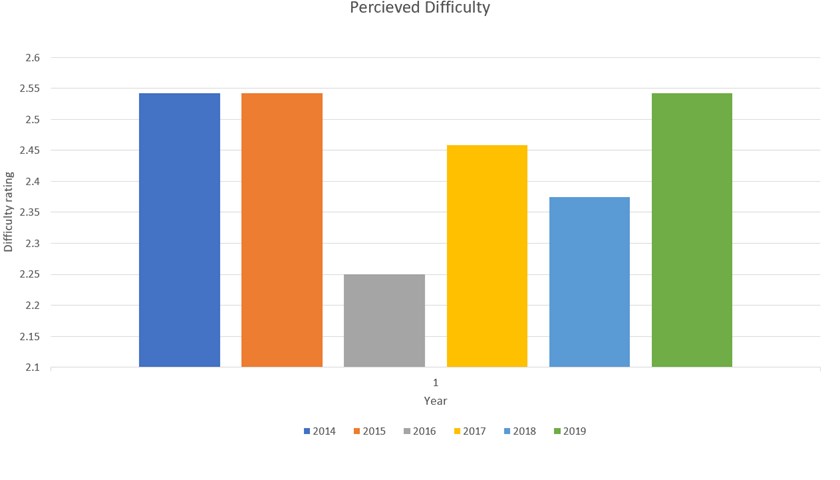
As in the graph above, the 2019 draw is considerably more difficult than the last three and is equally as difficult as both 2014 and 2015 (average 2.54).
However, the perceived difficulty doesn't always equal the actual difficulty. By using the same system, we graded teams on where they finished during that season opposed to the season prior. You can see the differences in the following graph.
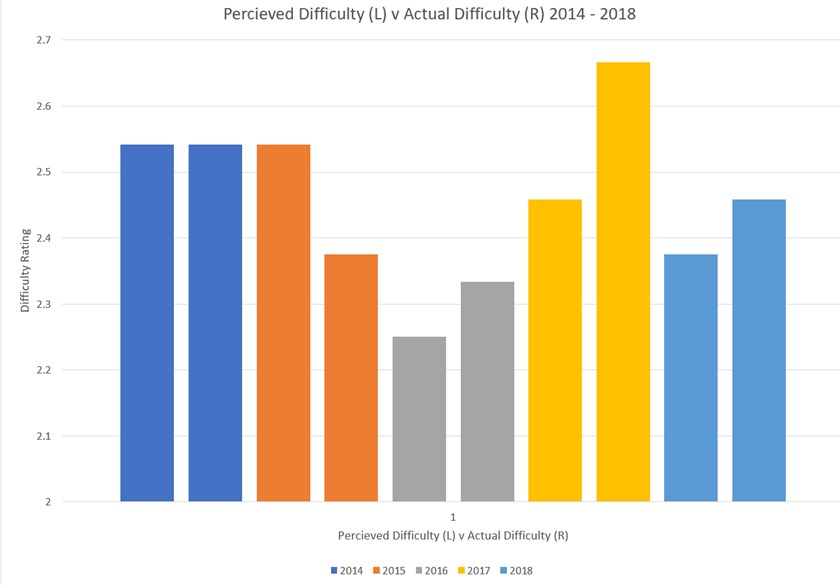
In all seasons bar 2015, the actual difficulty rating was higher than the perceived difficulty rating. The highest actual rating came during the 2017 season with an average of 2.67. The lowest actual rating came in 2016 with an average of 2.25.
Home v Away
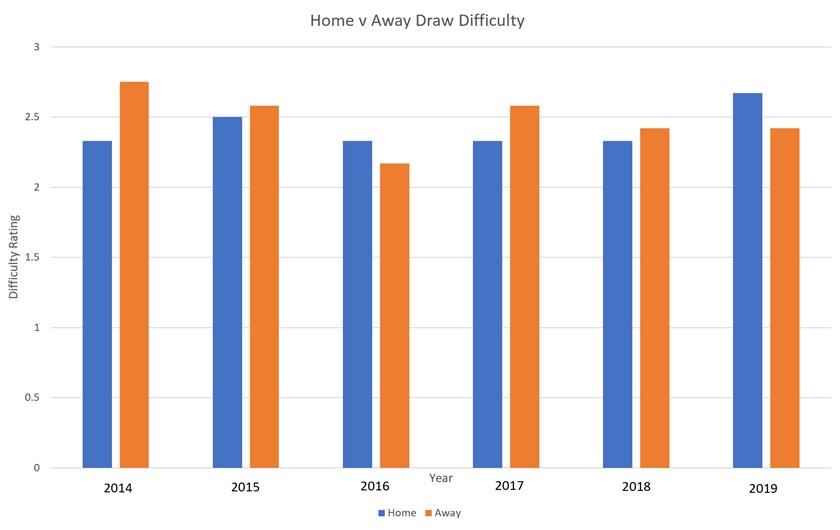
To compare the difficulties of the home and away draw from 2014-2019, we have collected the average potential difficulty ratings.
From 2014 – 2019, the upcoming campaign has the most difficult home draw with an average rating of 2.67.
The 2019 away draw difficulty is equal to last years (average 2.42). We only had an easier potential rating in 2016.
Remarkably, 2019 is only the second season in this period to have a more difficult home rating than away rating.
Five Game Breakdowns
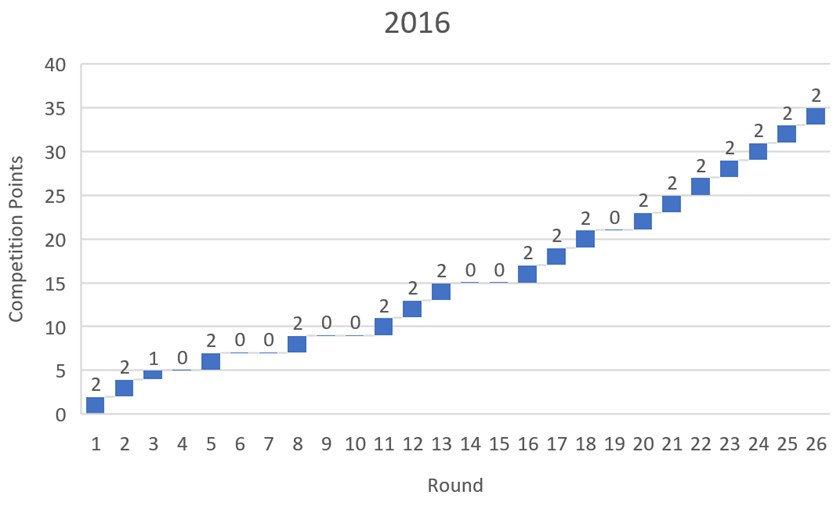
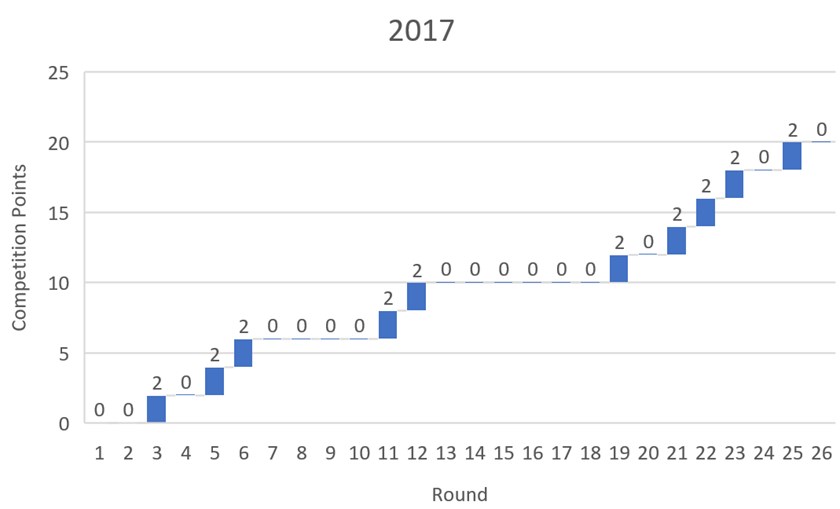
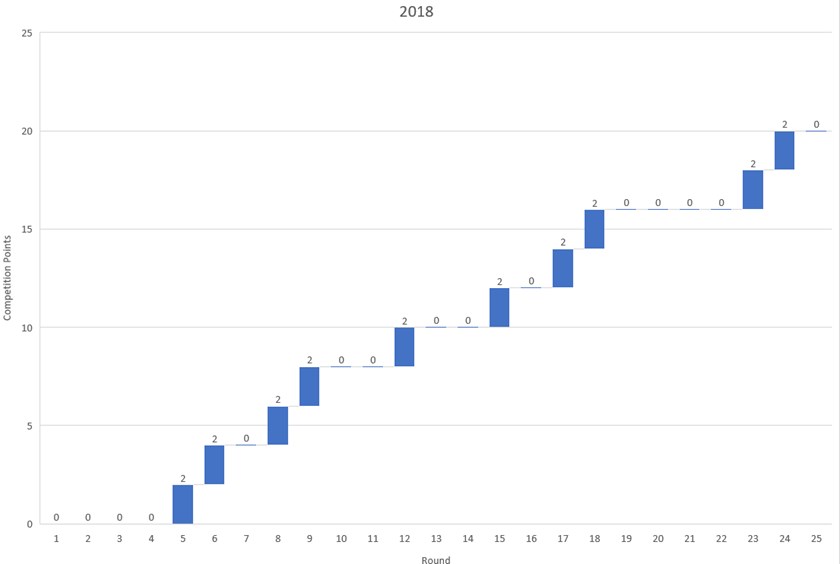
To gather a further understanding of recent patterns across our matches, we have taken a deeper look at the last three seasons to see when we have accrued competition points.
For the purposes of this exercise, we have not included points awarded from the bye. Also, it is important to note that the 2016 and 2017 season had 26 rounds with two byes. The 2018 and 2019 season have 25 rounds which includes one bye.
Rounds 1 – 5
| Year | Points Accrued | Average Potential Difficulty |
|---|---|---|
| 2016 | 7 | 2.4 |
| 2017 | 4 | 2.8 |
| 2018 | 2 | 1.6 |
| 2019 | - | 1.8 |
Last season was evidence of the importance of a good start to the season. It took us until Round 5 to pick up competition points despite an easier start to the year.
Across the last three seasons, we enjoyed our best start in 2016 and it's no surprise that it coincided with our most recent finals appearance.
For the upcoming season, we face three of the four sides that finished in the bottom four in 2018.
2019 Matches: Gold Coast Titans (A), Melbourne Storm (H), Newcastle Knights (H), North Queensland Cowboys (A), Parramatta Eels (H)
Rounds 6-10
| Year | Points Accrued | Average Potential Difficulty |
|---|---|---|
| 2016 | 2 | 2 |
| 2017 | 2 | 2 |
| 2018 | 6 | 2.6 |
| 2019 | - | 3 |
When breaking the 2019 draw into five game periods, Rounds 6-10 is our second most difficult run.
In recent seasons it hasn't been the most ideal period for us but 2018 was a noticeable improvement as we tripled our recent wins despite a higher average difficulty rating.
In 2019, it's rated higher again with a split of three home games and two away matches.
2019 Matches: Brisbane Broncos (H), Manly Sea Eagles (A), Penrith Panthers (H), Sydney Roosters (A), South Sydney Rabbitohs (H)
Rounds 11-15
| Year | Points Accrued | Average Potential Difficulty |
|---|---|---|
| 2016 | 6 | 2.5 |
| 2017 | 4 | 1.5 |
| 2018 | 4 | 2.25 |
| 2019 | - | 2 |
The Origin Period starts within this five game window but we'll take a further look at that in detail further down.
In the last three seasons, we have only played four matches in this period and picked up at least two wins.
After the opening five matches in 2019, this five game window is potentially our easiest for the season as we face only one side that made the top eight in 2018.
However, one of the most challenging prospects in this period is the Round 15 match against the Parramatta Eels in Darwin. It'll be our first match in the city since 2014.
2019 Matches: North Queensland Cowboys (H), Canterbury-Bankstown Bulldogs (A), Wests Tigers (A), Cronulla-Sutherland Sharks (H), Parramatta Eels (A)
Rounds 16-20
| Year | Points Accrued | Average Potential Difficulty |
|---|---|---|
| 2016 | 8 | 2 |
| 2017 | 2 | 3.25 |
| 2018 | 6 | 3.2 |
| 2019 | - | 2.75 |
This period can make or break a season.
In 2016 we won every single match as we surged up the ladder. 2017 was a horror show with only one win. 2018 was mixed with three wins and two losses.
The potential difficulty for 2019 is ranked 2.75 as we play three teams that made the eight this year and the ninth placed Tigers.
This window of five matches also sees us play at home only once, with a trip to New Zealand due in Round 20.
2019 Matches: Bye, St George-Illawarra Dragons (A), Wests Tigers (H), Penrith Panthers (A), New Zealand Warriors (A)
Rounds 21-25
| Year | Points Accrued | Average Potential Difficulty |
|---|---|---|
| 2016* | 10 | 2.6 |
| 2017* | 8 | 2.4 |
| 2018 | 4 | 2.2 |
| 2019 | - | 3.2 |
The run home for 2019 is our most difficult in recent seasons and is also the window with the highest average potential difficulty rating.
In 2016 and 2017 we finished the regular season in style but this year we finished the year with two wins.
Interestingly, 2018 had the lowest average potential difficulty but in reality, we played four teams in the top eight and the ninth placed Tigers.
Although a lot can transpire between now and the final five rounds of 2019, it certainly looks a tough prospect on paper as we face three of this year's top four sides.
2019 Matches: Sydney Roosters (H), Melbourne Storm (A), Manly Sea Eagles (H), Cronulla-Sutherland Sharks (A), New Zealand Warriors (H)
The Origin Period
Due to the slight shift of State of Origin from year to year, we've gathered statistics from this period from the 2016 season.
| Year | Rounds | Matches Played | Points Accrued | Average Potential Difficulty |
|---|---|---|---|---|
| 2016 | 12-19 | 6 | 10 | 2.67 |
| 2017 | 12-19 | 6 | 4 | 2.33 |
| 2018 | 13-18 | 5 | 6 | 2.8 |
| 2019 | 12-17 | 5 | - | 2.4 |
From a small sample, we have accrued more points in the two seasons when we've played opposition with a higher average potential difficulty rating.
This correlation is likely to be due to the fact that teams that perform well generally have players selected for New South Wales and Queensland.
In 2019, we have a rating that is similar to that of 2017 which means it is likely we will be playing against other teams who won't be depleted by State of Origin.
If we are able to string results together during this period like we did in 2016 and 2018, it could set us up well for the rest of the year.
Summary
The draw isn't the toughest we could have received and the fact that our home games have a higher average potential difficulty rating than our away games could put us in good stead.
With a difficult final window of five games, it's important that we notch up wins early and during the Origin Period.


