You have skipped the navigation, tab for page content


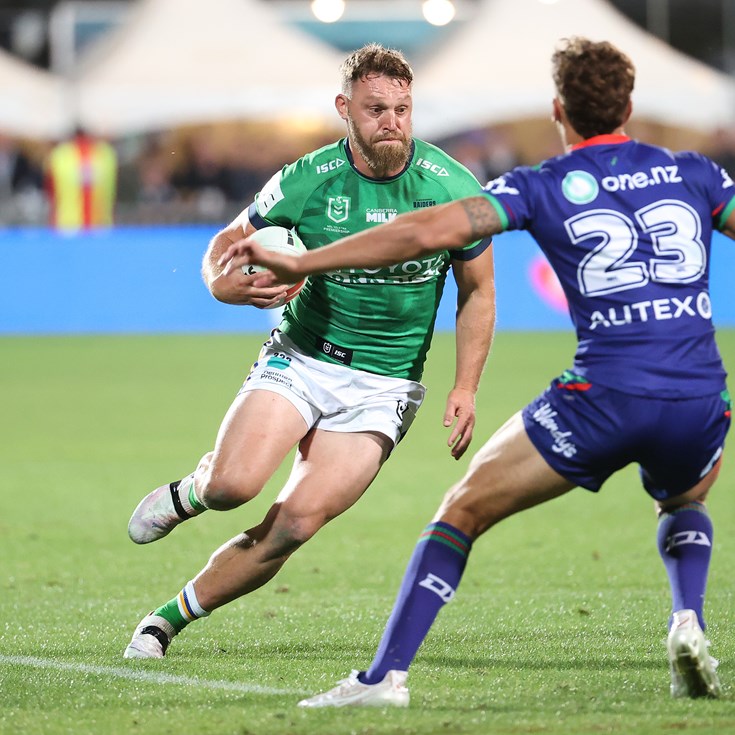
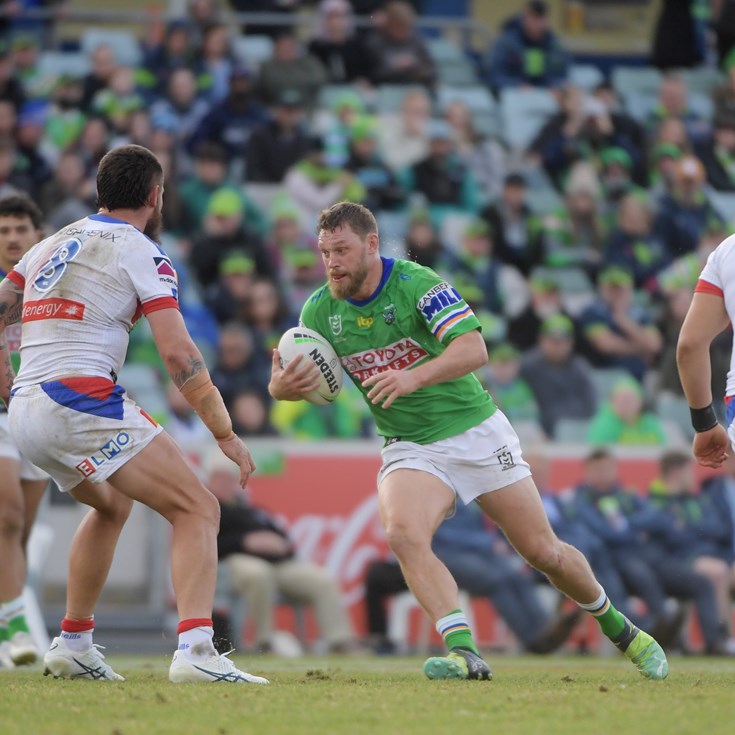
Elliott Whitehead
Captain - 2nd Row
Player Bio
- Height:
- 189 cm
- Date of Birth:
- 04 September 1989
- Weight:
- 105 kg
- Birthplace:
- Bradford, UK
- Age:
- 34
- Nickname:
- -
- Debut Club:
- Canberra Raiders
- Date:
- 05 March 2016
- Opposition:
- Penrith Panthers
- Round:
- 1
- Previous Club:
- Catalans Dragons, Bradford Bulls
- Junior Club:
- West Bowling Juniors
- Biography:
Whitehead continued to lead from the front in 2023, with the Englishman leading the Raiders around the park for another consecutive season. The backrower showed his versatility this season, lining up in both the second-row and lock-forward.
Whitehead begins the season only 11 matches away from reaching 200 NRL games, which would be an incredible milestone for the English International.
Career
- Appearances
- 191
- Tries
- 41
2024 Season
- Appearances
- 2
Scoring
- Tries
- 2
Attack
- Line Breaks
- 1
- Line Break Assists
- 0
Passing
- Offloads
- 2
Defence
- Tackles Made
- 54
- Tackle Efficiency
-
Running Metres
- Average Running Metres
- 55
- Total Running Metres
- 110
Fantasy
- Total Points
- 107
- Average Points
- 53.5
2024 Season - By Round
| Round | Opponent | Score | Position | Minutes Played | Tries | Goals | 1 Point Field Goals | 2 Point Field Goals | Points | Kicking Metres | Try Assists | Linebreaks | Tackle Breaks | Post Contact Metres | Offloads | Receipts | Tackles Made | Missed Tackles | Total Running Metres | Hit Up Running Metres | Kick Return Metres | |
|---|---|---|---|---|---|---|---|---|---|---|---|---|---|---|---|---|---|---|---|---|---|---|
| 3 | Warriors | Lost | 18 - 10 | 2nd Row | 34 | - | - | - | - | - | 20 | - | - | 1 | 14 | - | 8 | 25 | - | 40 | 36 | - |
| 9 | Sea Eagles | Won | 24 - 26 | 2nd Row | 80 | 2 | - | - | - | 8 | - | 1 | 1 | 4 | 12 | 2 | 13 | 29 | 2 | 69 | 60 | - |
Career By Season
| Year | Played | Won | Lost | Drawn | Win % | Tries | Goals | 1 Point Field Goals | 2 Point Field Goals | Points | Kicking Metres | Kicking Metres Average | Forced Drop Outs | Linebreaks | Offloads | Tackles Made | Missed Tackles | Tackle Efficiency | Total Running Metres | Average Running Metres | Kick Return Metres | Total Points | Average Points | |
|---|---|---|---|---|---|---|---|---|---|---|---|---|---|---|---|---|---|---|---|---|---|---|---|---|
| Raiders | 2016 | 27 | 18 | 8 | 1 | 67% | 6 | - | - | - | 24 | 6 | 0.22 | - | 6 | 11 | 1,062 | 60 | 91.29% | 2,279 | 84.00 | 35 | 1,372 | 50.8 |
| Raiders | 2017 | 23 | 10 | 13 | - | 43% | 5 | - | - | - | 20 | 72 | 3.11 | - | 3 | 12 | 769 | 77 | 90.90% | 1,926 | 83.00 | 9 | 938 | 40.8 |
| Raiders | 2018 | 24 | 10 | 14 | - | 42% | 10 | - | - | - | 40 | 64 | 2.67 | - | 6 | 8 | 697 | 75 | 90.28% | 2,077 | 86.00 | 91 | 868 | 36.2 |
| Raiders | 2019 | 27 | 17 | 10 | - | 63% | 3 | - | - | - | 12 | 13 | 0.49 | - | 3 | 21 | 881 | 88 | 90.92% | 2,025 | 75.00 | 32 | 1,035 | 38.3 |
| Raiders | 2020 | 22 | 15 | 7 | - | 68% | 5 | - | - | - | 20 | 105 | 4.78 | - | 7 | 10 | 688 | 58 | 92.23% | 1,697 | 77.00 | 63 | 876 | 39.8 |
| Raiders | 2021 | 21 | 7 | 14 | - | 33% | 4 | - | - | - | 16 | 45 | 2.15 | 1 | 4 | 15 | 680 | 69 | 90.79% | 1,578 | 75.00 | 9 | 881 | 42.0 |
| Raiders | 2022 | 22 | 13 | 9 | - | 59% | 3 | - | - | - | 12 | 33 | 1.50 | - | 5 | 15 | 677 | 68 | 90.87% | 1,342 | 61.00 | 18 | 775 | 35.2 |
| Raiders | 2023 | 23 | 11 | 12 | - | 48% | 3 | - | - | - | 12 | 25 | 1.09 | 1 | 2 | 22 | 820 | 79 | 91.21% | 1,613 | 70.00 | 6 | 994 | 43.2 |
| Raiders | 2024 | 2 | 1 | 1 | - | 50% | 2 | - | - | - | 8 | 20 | 9.90 | - | 1 | 2 | 54 | 2 | 96.43% | 110 | 55.00 | - | 107 | 53.5 |
Career Overall
| Year Start | Year End | Played | Won | Lost | Drawn | Win % | Tries | Goals | 1 Point Field Goals | 2 Point Field Goals | Points | Kicking Metres | Kicking Metres Average | Forced Drop Outs | Linebreaks | Offloads | Tackles Made | Missed Tackles | Tackle Efficiency | Total Running Metres | Average Running Metres | Kick Return Metres | Total Points | Average Points | |
|---|---|---|---|---|---|---|---|---|---|---|---|---|---|---|---|---|---|---|---|---|---|---|---|---|---|
| Raiders | 2016 | 2024 | 191 | 102 | 88 | 1 | 53% | 41 | - | - | - | 164 | 383 | 1.99 | 2 | 37 | 116 | 5,929 | 576 | 91.15% | 13,779 | 71.00 | 246 | 7,362 | 38.5 |
Latest


Team Mates


Canberra Raiders respect and honour the Traditional Custodians of the land and pay our respects to their Elders past, present and future. We acknowledge the stories, traditions and living cultures of Aboriginal and Torres Strait Islander peoples on the lands we meet, gather and play on.