You have skipped the navigation, tab for page content


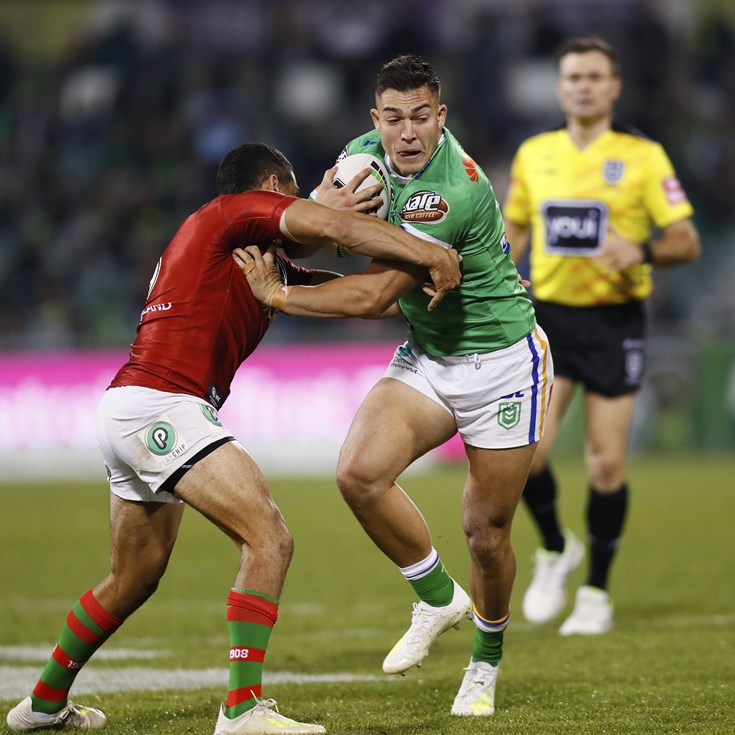
Nick Cotric
Winger
Player Bio
- Height:
- 185 cm
- Date of Birth:
- 18 November 1998
- Weight:
- 98 kg
- Birthplace:
- Canberra, ACT
- Age:
- 25
- Nickname:
- -
- Debut Club:
- Canberra Raiders
- Date:
- 04 March 2017
- Opposition:
- North Queensland Cowboys
- Round:
- 1
- Previous Club:
- Canterbury-Bankstown Bulldogs
- Junior Club:
- Tuggeranong Valley Dragons
- Biography:
Nick Cotric had a challenging start to 2023, injuring his hamstring in Round Two before tearing his calf mid-way through the year. Cotric spent some time covering as a utility off the bench before finishing the season back on his usual right-wing.
Cotric scored two tries in the last six matches and came up with some big defensive plays which helped the Raiders reach the finals.
Career
- Appearances
- 143
- Tries
- 60
2024 Season
- Appearances
- 2
Scoring
- Tries
- 1
Attack
- Try Assists
- 0
- Line Breaks
- 1
- Tackle Breaks
- 6
Passing
- Receipts
- 36
Defence
- Tackles Made
- 9
- Missed Tackles
- 0
- Tackle Efficiency
-
Running Metres
- Average Running Metres
- 122
- Total Running Metres
- 244
Fantasy
- Total Points
- 58
- Average Points
- 29
2024 Season - By Round
| Round | Opponent | Score | Position | Minutes Played | Tries | Goals | 1 Point Field Goals | 2 Point Field Goals | Points | Kicking Metres | Try Assists | Linebreaks | Tackle Breaks | Post Contact Metres | Offloads | Receipts | Tackles Made | Missed Tackles | Total Running Metres | Hit Up Running Metres | Kick Return Metres | |
|---|---|---|---|---|---|---|---|---|---|---|---|---|---|---|---|---|---|---|---|---|---|---|
| 1 | Knights | Won | 12 - 28 | Winger | 80 | - | - | - | - | - | 22 | - | - | 3 | 26 | - | 16 | 5 | - | 103 | - | 9 |
| 2 | Wests Tigers | Won | 32 - 12 | Replacement | - | - | - | - | - | - | - | - | - | - | - | - | - | - | - | - | - | - |
| 3 | Warriors | Lost | 18 - 10 | Winger | 80 | 1 | - | - | - | 4 | - | - | 1 | 3 | 43 | - | 20 | 4 | - | 141 | 11 | 11 |
| 4 | Sharks | Lost | 36 - 22 | Replacement | - | - | - | - | - | - | - | - | - | - | - | - | - | - | - | - | - | - |
Career By Season
| Year | Played | Won | Lost | Drawn | Win % | Tries | Goals | 1 Point Field Goals | 2 Point Field Goals | Points | Kicking Metres | Kicking Metres Average | Goal Conversion Rate | Forced Drop Outs | Try Assists | Linebreaks | Receipts | Tackles Made | Missed Tackles | Tackle Efficiency | Total Running Metres | Average Running Metres | Kick Return Metres | Total Points | Average Points | |
|---|---|---|---|---|---|---|---|---|---|---|---|---|---|---|---|---|---|---|---|---|---|---|---|---|---|---|
| Raiders | 2017 | 24 | 11 | 13 | - | 46% | 16 | - | - | - | 64 | 148 | 6.15 | - | 2 | 2 | 17 | 315 | 74 | 19 | 79.57% | 2,581 | 107.00 | 403 | 899 | 37.5 |
| Raiders | 2018 | 24 | 10 | 14 | - | 42% | 12 | - | - | - | 48 | 88 | 3.68 | - | - | 1 | 20 | 371 | 61 | 20 | 75.31% | 2,628 | 109.00 | 555 | 882 | 36.8 |
| Raiders | 2019 | 22 | 13 | 9 | - | 59% | 4 | - | - | - | 16 | 142 | 6.43 | - | - | 3 | 7 | 266 | 132 | 26 | 83.54% | 2,175 | 98.00 | 250 | 578 | 26.3 |
| Raiders | 2020 | 23 | 16 | 7 | - | 70% | 14 | - | - | - | 56 | 161 | 7.01 | - | 1 | 2 | 14 | 331 | 93 | 22 | 80.87% | 2,558 | 111.00 | 437 | 855 | 37.2 |
| Bulldogs | 2021 | 14 | 2 | 12 | - | 14% | 3 | - | - | - | 12 | 95 | 6.77 | - | - | 1 | 7 | 237 | 68 | 22 | 75.56% | 1,823 | 130.00 | 152 | 443 | 31.6 |
| Raiders | 2022 | 21 | 11 | 10 | - | 52% | 7 | - | - | - | 28 | 124 | 5.89 | - | 1 | 2 | 11 | 303 | 70 | 17 | 80.46% | 2,300 | 109.00 | 386 | 591 | 28.1 |
| Raiders | 2023 | 13 | 6 | 7 | - | 46% | 3 | - | - | - | 12 | 14 | 1.12 | - | - | - | 6 | 158 | 37 | 16 | 69.81% | 1,079 | 83.00 | 50 | 253 | 19.5 |
| Raiders | 2024 | 2 | 1 | 1 | - | 50% | 1 | - | - | - | 4 | 22 | 10.75 | - | - | - | 1 | 36 | 9 | - | 100.00% | 244 | 122.00 | 20 | 58 | 29.0 |
Career Overall
| Year Start | Year End | Played | Won | Lost | Drawn | Win % | Tries | Goals | 1 Point Field Goals | 2 Point Field Goals | Points | Kicking Metres | Kicking Metres Average | Goal Conversion Rate | Forced Drop Outs | Try Assists | Linebreaks | Receipts | Tackles Made | Missed Tackles | Tackle Efficiency | Total Running Metres | Average Running Metres | Kick Return Metres | Total Points | Average Points | |
|---|---|---|---|---|---|---|---|---|---|---|---|---|---|---|---|---|---|---|---|---|---|---|---|---|---|---|---|
| Raiders |
2017
2022 |
2020
2024 |
129 | 68 | 61 | - | 53% | 57 | - | - | - | 228 | 676 | 5.08 | - | 4 | 10 | 76 | 1,778 | 433 | 120 | 78.30% | 12,120 | 91.00 | 1,905 | 3,927 | 30.4 |
| Bulldogs | 2021 | 2021 | 14 | 2 | 12 | - | 14% | 3 | - | - | - | 12 | 95 | 6.77 | - | - | 1 | 7 | 237 | 68 | 22 | 75.56% | 1,823 | 130.00 | 152 | 443 | 31.6 |
Latest


Team Mates


Canberra Raiders respect and honour the Traditional Custodians of the land and pay our respects to their Elders past, present and future. We acknowledge the stories, traditions and living cultures of Aboriginal and Torres Strait Islander peoples on the lands we meet, gather and play on.