
Metre Eaters:
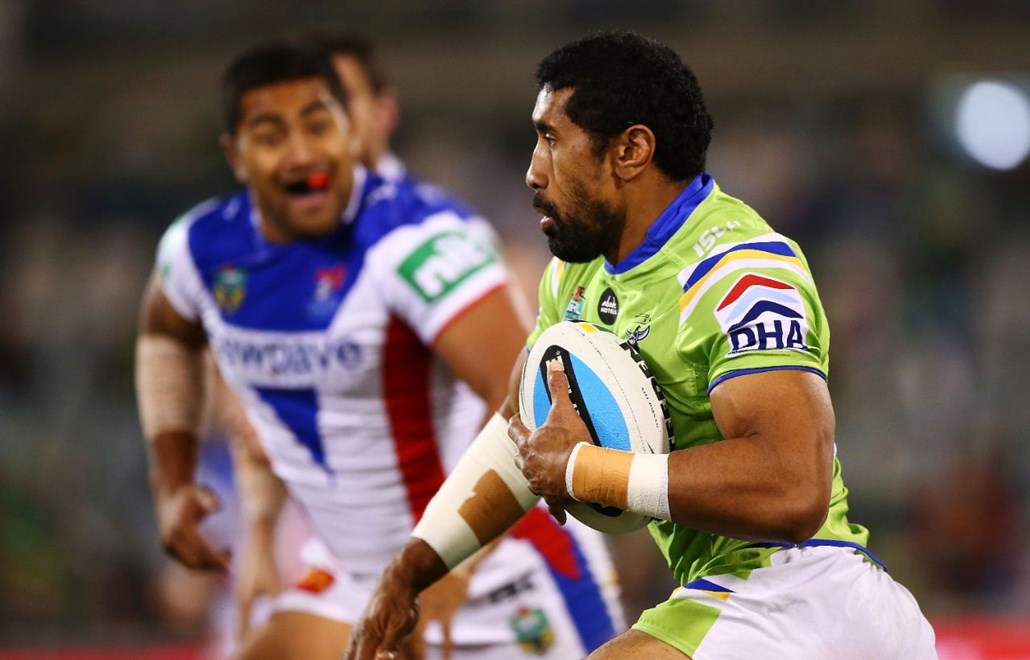
1. David Shillington 160 metres
2. Edrick Lee 132 metres
3. Shaun Fensom 121 metres
Top Tacklers:
1. Sia Soliola 42 tackles
2. Josh Hodgson 37 tackles
3. Shaun Fensom 33 tackles
Most Creative:
1. Sam Williams 3 try assists and 1 line break assist
2. Paul Vaughan 1 try assist and 1 line break assist
3. Josh Hodgson and Jordan Rapana 1 try assist
Second Phase Play:
1. Edrick Lee, Paul Vaughan and Sam Williams 1 offload
Damaging Runners:
1. Josh Papalii 1 line break and 2 tackle busts
2. Blake Ausin 1 line break and 1 tackle bust
3. Jordan Rapana 1 line break
Line Breaks:
Interestingly, the Knights registered 6, double the amount the Raiders made.
Kick Metres:
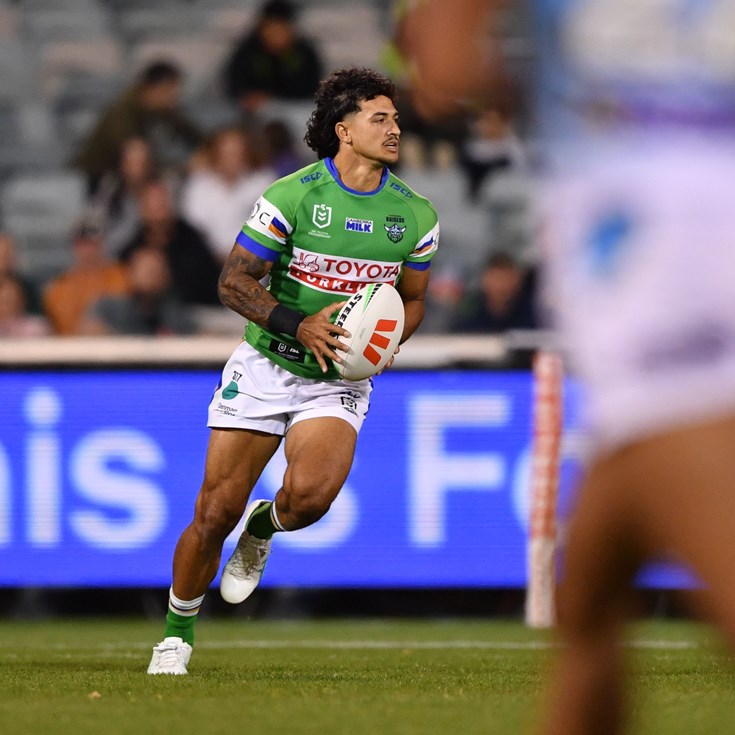
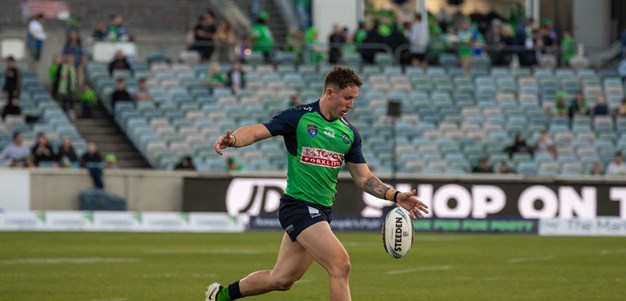
1. Sam Williams 10 kicks for 342 metres
2. Blake Austin 7 kicks 253 metres
3. Jack Wighton 2 kicks for 77 metres
Possession Rate:
The Knights enjoyed 59% of possession.
Completion Rate:
The Raiders completed 29 out of 35 sets for a completion rate of 82.9%, whilst the Raiders had a completion rate of 87.8%.
Errors:
The Raiders registered 7 errors whilst the Knights registered 6.
Line Drop Outs:
The Raiders were forced to perform 4 line drop outs.
Missed Tackles:
The Raiders missed a 33 tackles, whilst the Knights missed 18.
Penalties Conceded:
The Raiders conceded 7 penalties, whilst the Knights conceded 5.
*Statistics provided by ProZone Sports.


