You have skipped the navigation, tab for page content


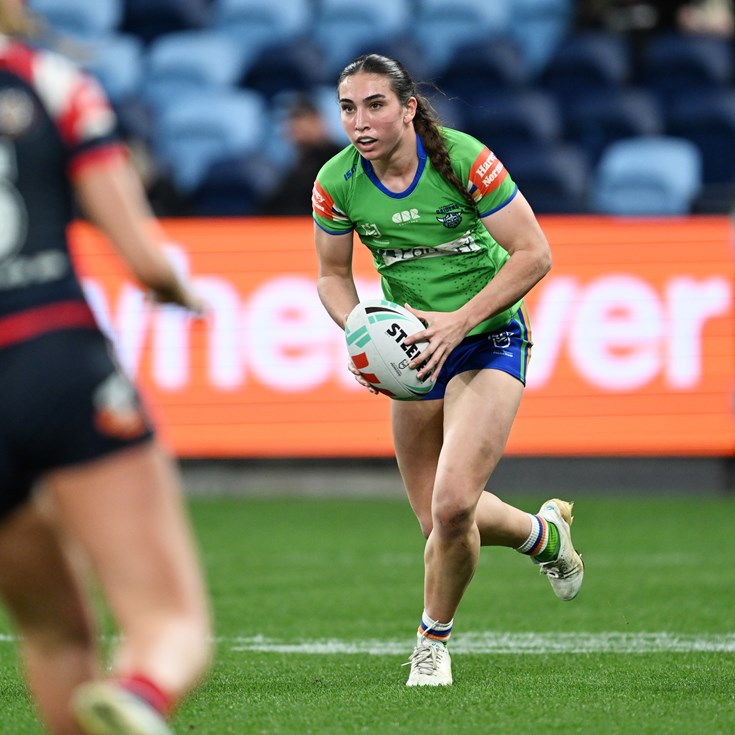
Chloe Saunders
Lock
Player Bio
- Height:
- 173 cm
- Date of Birth:
- 03 August 1999
- Weight:
- 73 kg
- Birthplace:
- Kempsey, NSW
- Age:
- 26
- Nickname:
- Chlo
- Debut Club:
- Cronulla-Sutherland Sharks Women
- Date:
- 23 July 2023
- Opposition:
- Canberra Raiders Women
- Round:
- 1
- Previous Club:
- Cronulla-Sutherland Sharks Women
- Junior Club:
- -
- Biography:
Chloe Saunders joins the Raiders this season and is locked in until the end of the 2027 NRLW season.
Saunders played 18 games for the Cronulla Sharks over the past two seasons, helping them get to their first grand final appearance in 2024.
The 25-year-old has a background in rugby sevens and cricket, making the switch to rugby league in the lead up to the 2023 NRLW season.
Career
- Appearances
- 29
- Tries
- 4
2025 Season
- Appearances
- 11
Scoring
- Tries
- 2
Attack
- Tackle Breaks
- 25
- Average Hit Ups
- 7.6
- Post Contact Metres
- 305.9
Passing
- Offloads
- 0
Defence
- Tackles Made
- 250
- Tackle Efficiency
-
Running Metres
- Average Running Metres
- 73
- Total Running Metres
- 811
Fantasy
- Total Points
- 332
- Average Points
- 30.2
2025 Season - By Round
| Round | Opponent | Score | Position | Minutes Played | Tries | Goals | 1 Point Field Goals | 2 Point Field Goals | Points | Kicking Metres | Try Assists | Linebreaks | Tackle Breaks | Post Contact Metres | Offloads | Receipts | Tackles Made | Missed Tackles | Total Running Metres | Hit Up Running Metres | Kick Return Metres | |
|---|---|---|---|---|---|---|---|---|---|---|---|---|---|---|---|---|---|---|---|---|---|---|
| 1 | Dragons | Lost | 14 - 36 | Prop | 36 | - | - | - | - | - | - | - | - | 1 | 25 | - | 7 | 13 | 2 | 52 | 30 | 22 |
| 2 | Sharks | Lost | 6 - 56 | Prop | 31 | - | - | - | - | - | - | - | - | 2 | 12 | - | 3 | 21 | 4 | 29 | 29 | - |
| 3 | Eels | Lost | 12 - 46 | Prop | 52 | - | - | - | - | - | - | - | 1 | 3 | 31 | - | 9 | 27 | 3 | 90 | 90 | - |
| 4 | Cowboys | Lost | 26 - 0 | Interchange | 34 | - | - | - | - | - | - | - | - | 2 | 33 | - | 9 | 21 | 2 | 86 | 78 | 7 |
| 5 | Knights | Lost | 18 - 0 | Interchange | 33 | - | - | - | - | - | - | - | - | 4 | 40 | - | 7 | 21 | 1 | 79 | 79 | - |
| 6 | Broncos | Lost | 28 - 44 | Prop | 55 | 1 | - | - | - | 4 | - | - | 1 | 5 | 28 | - | 11 | 27 | 4 | 95 | 70 | 24 |
| 7 | Warriors | Won | 16 - 20 | Prop | 57 | - | - | - | - | - | 14 | 1 | - | 2 | 12 | - | 9 | 24 | 5 | 54 | 54 | - |
| 8 | Bulldogs | Won | 24 - 56 | Prop | 52 | 1 | - | - | - | 4 | - | 1 | - | 3 | 33 | - | 13 | 19 | 1 | 78 | 68 | 10 |
| 9 | Wests Tigers | Won | 17 - 16 | Prop | 40 | - | - | - | - | - | - | - | - | 1 | 27 | - | 9 | 19 | 2 | 71 | 67 | - |
| 10 | Roosters | Lost | 26 - 14 | Prop | 45 | - | - | - | - | - | - | - | - | 1 | 43 | - | 15 | 24 | 3 | 113 | 108 | 4 |
| 11 | Titans | Lost | 17 - 16 | Prop | 42 | - | - | - | - | - | - | - | - | 1 | 22 | - | 9 | 34 | 2 | 61 | 61 | - |
Career By Season
| Year | Played | Won | Lost | Drawn | Win % | Tries | Goals | 1 Point Field Goals | 2 Point Field Goals | Points | Kicking Metres | Kicking Metres Average | Tackle Breaks | Post Contact Metres | Offloads | Tackles Made | Missed Tackles | Tackle Efficiency | Total Running Metres | Average Running Metres | Kick Return Metres | Total Points | Average Points | |
|---|---|---|---|---|---|---|---|---|---|---|---|---|---|---|---|---|---|---|---|---|---|---|---|---|
| Sharks | 2023 | 9 | 4 | 5 | - | 44% | 2 | - | - | - | 8 | - | - | 4 | 267 | 1 | 162 | 14 | 92.05% | 698 | 77.00 | 68 | 230 | 25.6 |
| Sharks | 2024 | 9 | 7 | 2 | - | 78% | - | - | - | - | - | - | - | 8 | 261 | - | 148 | 15 | 90.80% | 675 | 75.00 | 49 | 195 | 21.7 |
| Raiders | 2025 | 11 | 3 | 8 | - | 27% | 2 | - | - | - | 8 | 14 | 1.25 | 25 | 306 | - | 250 | 29 | 89.61% | 811 | 73.00 | 68 | 332 | 30.2 |
Career Overall
| Year Start | Year End | Played | Won | Lost | Drawn | Win % | Tries | Goals | 1 Point Field Goals | 2 Point Field Goals | Points | Kicking Metres | Kicking Metres Average | Tackle Breaks | Post Contact Metres | Offloads | Tackles Made | Missed Tackles | Tackle Efficiency | Total Running Metres | Average Running Metres | Kick Return Metres | Total Points | Average Points | |
|---|---|---|---|---|---|---|---|---|---|---|---|---|---|---|---|---|---|---|---|---|---|---|---|---|---|
| Sharks | 2023 | 2024 | 18 | 11 | 7 | - | 61% | 2 | - | - | - | 8 | - | - | 12 | 528 | 1 | 310 | 29 | 91.45% | 1,374 | 76.00 | 118 | 425 | 23.6 |
| Raiders | 2025 | 2025 | 11 | 3 | 8 | - | 27% | 2 | - | - | - | 8 | 14 | 1.25 | 25 | 306 | - | 250 | 29 | 89.61% | 811 | 73.00 | 68 | 332 | 30.2 |
Latest


Team Mates


Canberra Raiders respect and honour the Traditional Custodians of the land and pay our respects to their Elders past, present and future. We acknowledge the stories, traditions and living cultures of Aboriginal and Torres Strait Islander peoples on the lands we meet, gather and play on.